And the amount of time they have kept the data logs in your cloud account has varied, but I think we’re down to seven days now. It’s not very long, it’s definitely less than a month. So you need to grab it and store it for yourself, but that’s what the various logging options will do.
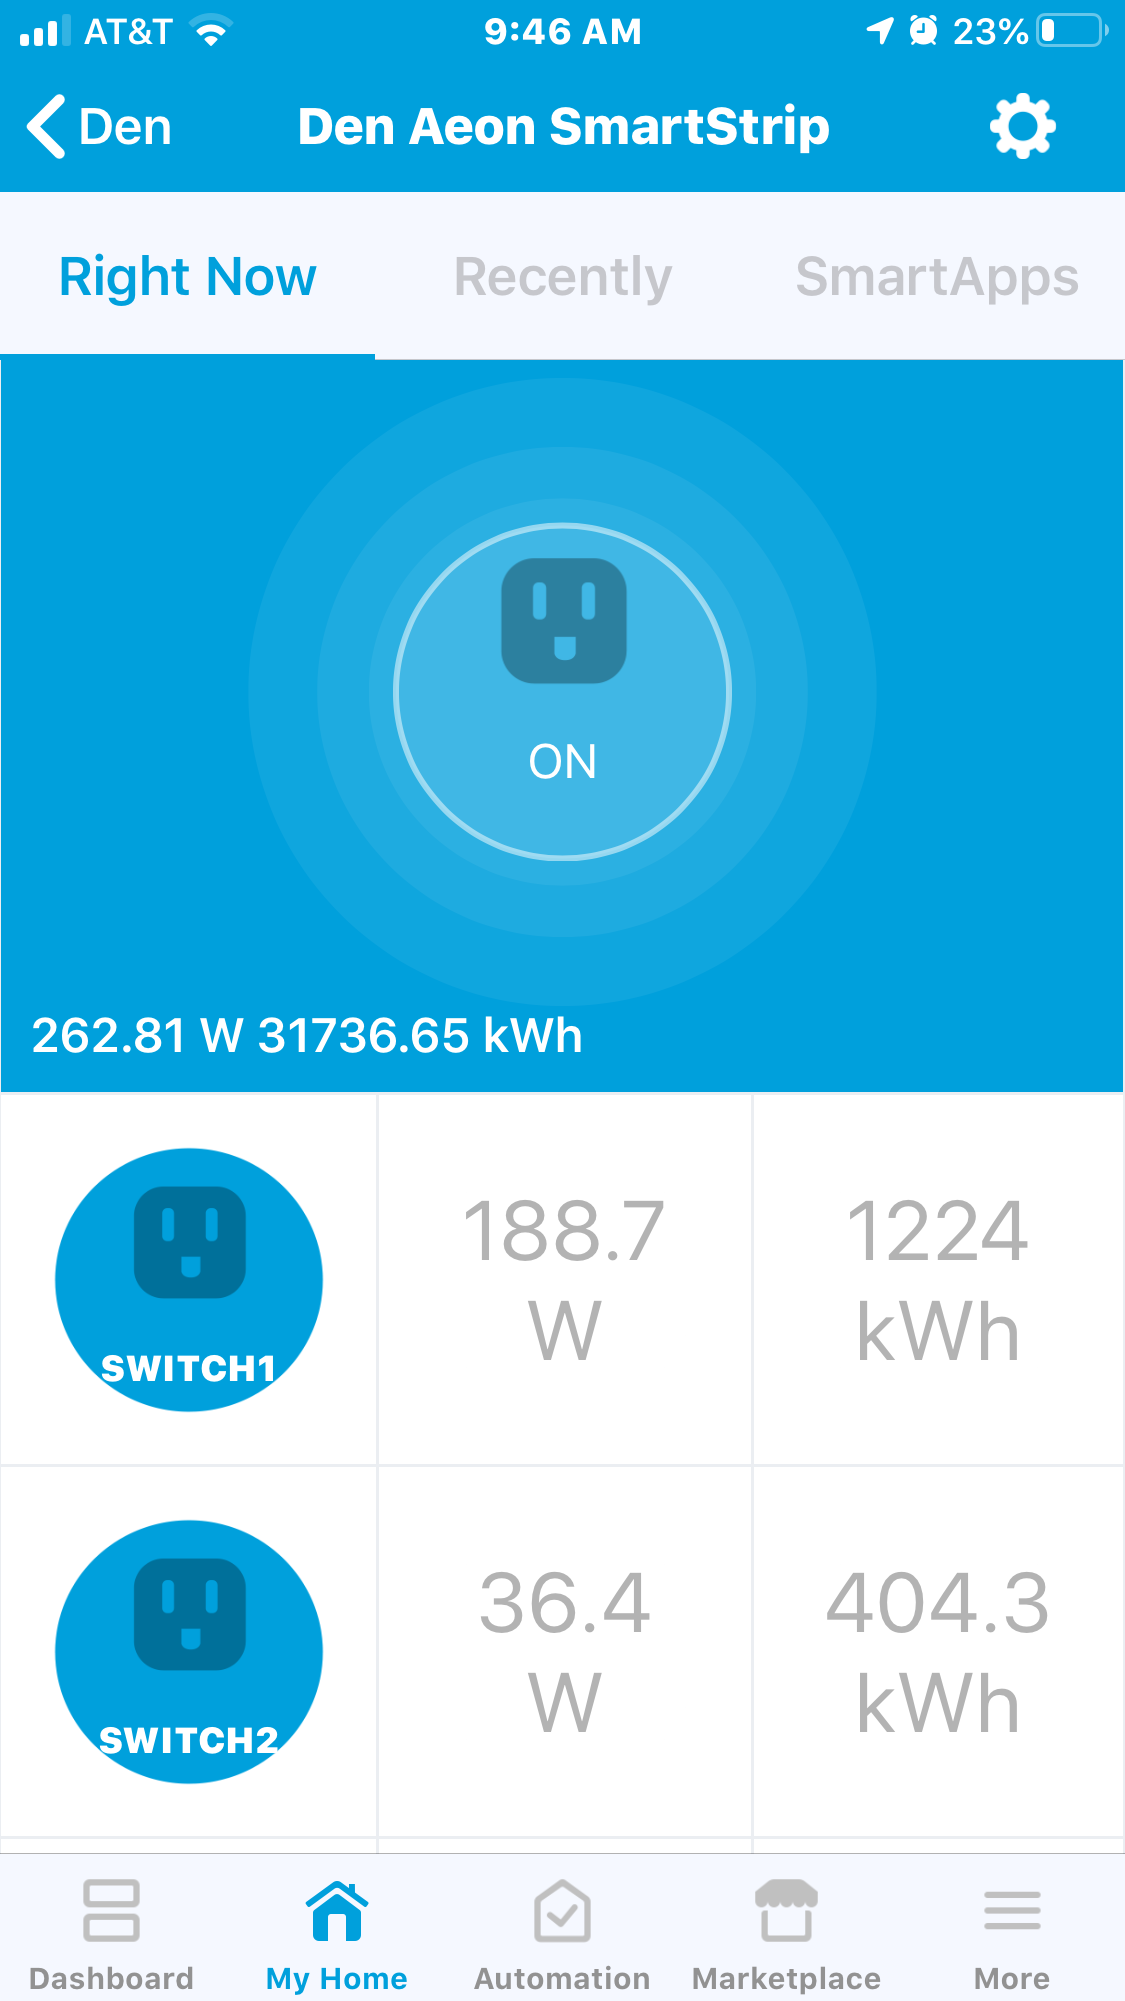
I really need to do this because I just realized today that since 10/14/17, my Den Entertainment has used close to 32,000 kWh. At $.12/kWh, that close to $4,000! Calculating monthly that about $150/month just on energy use from a room that I don’t ever use myself! It’s where the boys hang out gaming, etc.
Think this graphing expedition will help me cut some cost and lock the room down more when not in use.
I have tried graphing this and there is a nuance in how the device is configured to report. If you think about it the device should only report its kwh use once per hour since the standard is in hour interval. There are a number of ways that the device could report or how it posts that date. For example does it report a cumulative energy usage or does it post the amount used in one hour?
In my case what I have figured out was easier to read was wattage readings. There is no math to be done to verify use and it will still show you operating versus idle state etc.