Iris convert here. I’m beginning to understand the basics of SmartThings and the way custom device handlers and SmartApps work.
I paired my Aeotec by Aeon Labs energy monitor and saw it didn’t show up as any kind of official device. So I researched and saw there are device handlers for it. I set everything up correctly but I don’t see any options for graphs over time of usage or anything more robust than a live look at the wattage and amps detected by it.
Can someone point me in the right direction for a more robust Energy Monitor device handler. Also, not interested in buying other equipment. Want to stick with the Aeotec by Aeon Labs v5 if I can.
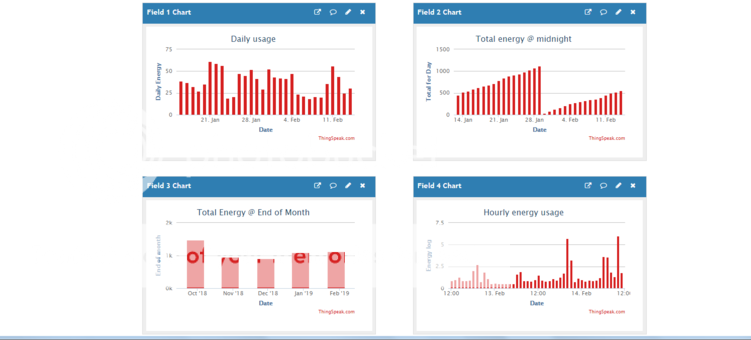
Getting a graphing option is not an simple task in ST. There are a few options. I use Thingsspeak for my Aeon Labs energy Monitor. Its a free for personal use website… There is an smartapp called Thingsspeak logger, the link above talks about it. . I used that as a basis to write my own energy monitoring smartapp. Below is a sample of my energy data. It’s not very sophisticated but it contains all the data I want to watch.
Not sure if you ever used the energy monitor with Iris, since they never implemented it in the V2 “upgrade”. But bottom line there is no simple solution like the V1 iris platform had, you must do a little setup to get it logging your data.
I did use the v1 Iris energy monitor and was pretty upset when I learned they weren’t bringing it to v2. I was looking forward to getting my EM working with ST upon switching. I’m surprised there isn’t official support on this platform.
Are your screenshots of the smartapp you wrote? Is that something you could and/or want to share? That data is basically what i’m looking to accomplish and visualize.
Did you look at the charting solutions FAQ that I gave you the link to? Here it is again.
All these solutions work the same way. You capture the data that is reported by your device, and you set it up to automatically plug into one of those charting solutions. The topic describes the various solutions, the cost if any, and usually has a couple of sample screens. Those are the ones the community members mostly use. ThingSpeak is one of the options covered in that topic.
When I try to create a ThingSpeak account on their website I get an error:
MathWorks Account Unavailable - Technical Issue
Due to a temporary problem, MathWorks Account is unavailable. Try again later.
If this problem persists, contact support (service@mathworks.com).
(ref:no-connection-error)
If you guys go to the signup page and type in one of your unused email addresses, do you get this error?
I literally have the exact same question - I just installed by Gen5 energy monitor yesterday and am flabbergasted that I cannot actually access the data via any default handler or smartapp.
The screenshot is from the things speak website. My app passes data to my thingsspeak account and then you must setup the graphs over there. My app works hand in hand with the DTH I modified slightly as well. It took me several weeks of reading and playing around with code to get what I wanted. I can post the DTH and code, but first you need to get a Things speak account setup. Not sure why it won’t let you I set mine up over a year ago.
Probably before you could make any sense of my smartapp, play around with this one
I use this to log temperature data from various sensors around my house.