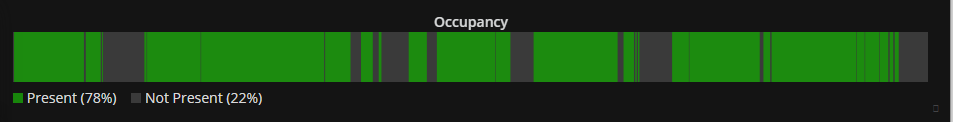
I just discovered that Grafana has a new Discrete panel type plug-in, which can be used to display measurements with non-numeric values, in particular binary and string values! This is perfect for displaying attributes such as presence, motion, smoke, switch, water, thermostat modes etc. ![]()
Some examples:
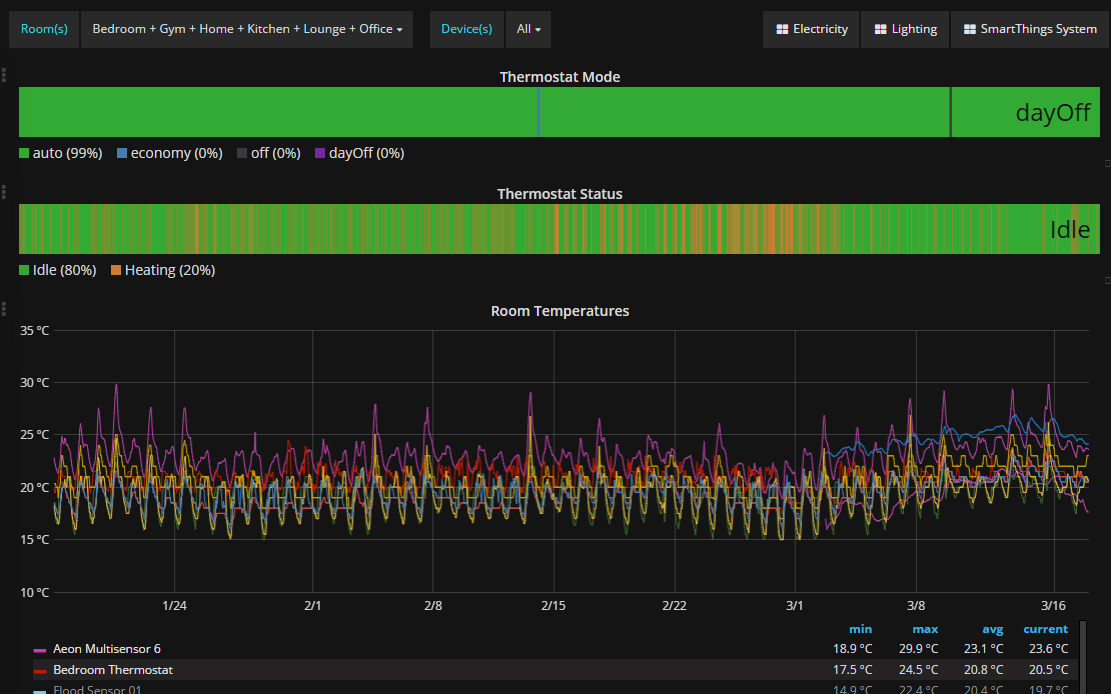
Now we can finally re-create some of the chart types that, up to now, I’d only seen in Initial State. ![]()