Glad to see more folks using this! I really think it’s the best free solution out there. Glad you and @allrak got your issues resolved. I hadn’t thought of doing this in the AWS cloud…@allrak Did you try this local first? I’m curious how the graphing is response wise being non-local…I may throwit up on my Azure account and test it out there too…
This is great. I didn’t have to do anything. 
FYI, it appears that sendHubCommand() now supports a callback feature so it should be possible to process any http response from InfluxDB. This should help diagnose some of these types of problems, although I’m not sure if it will help with timeouts when you get the target host wrong. 
Anyway, I will try to add some better debugging features when I get a chance.
1 Like
I didn’t try it local, as my local debian server is i386… From everything I could find, influxdb/grafana is 64-bit only.
That’s why i went with an EC2 instance on AWS. (64-bit).
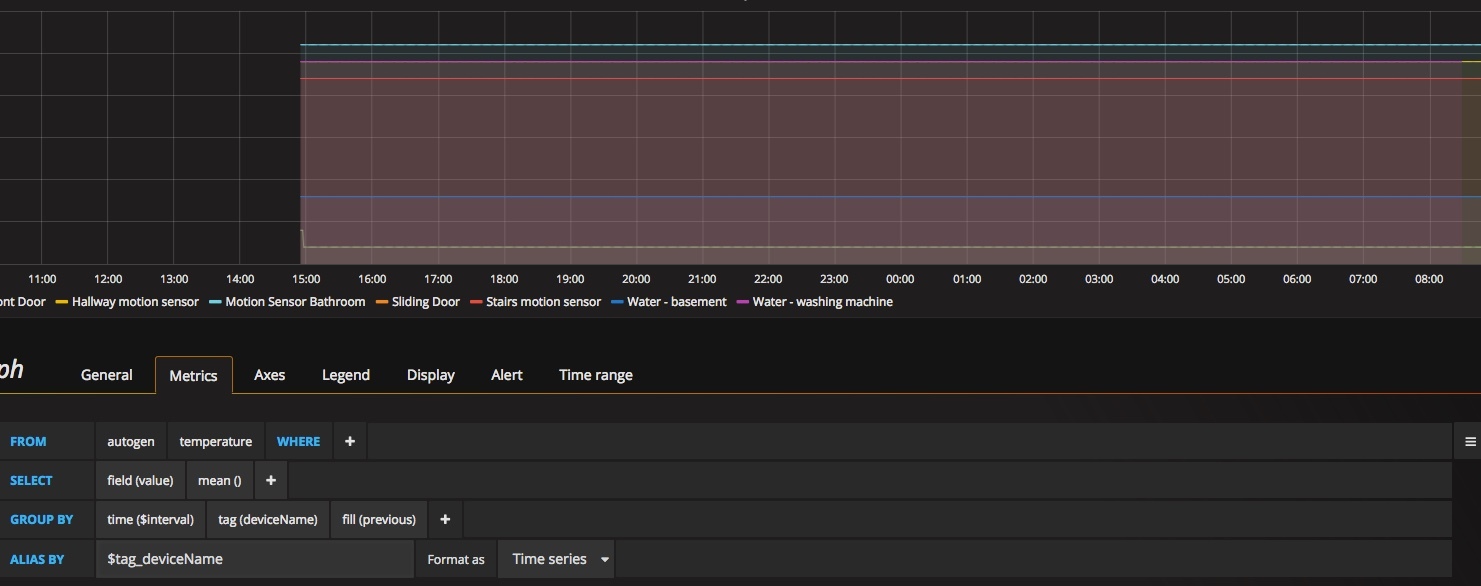
So everything was humming along yesterday, data was being sent and graphed with no issues.
It decided to quit yesterday, not sure why yet… I’ll play around with it some more.
You can see in the picture the datapoints are stagnant, which cannot be right.
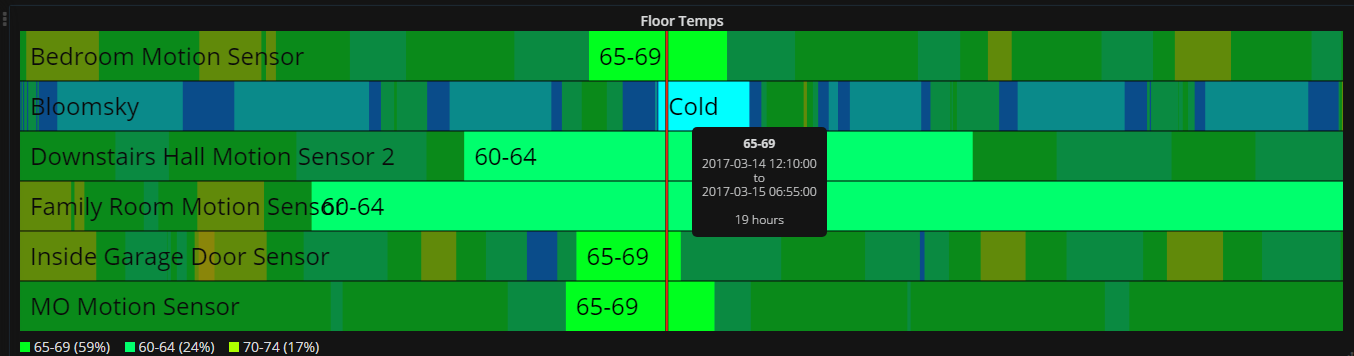
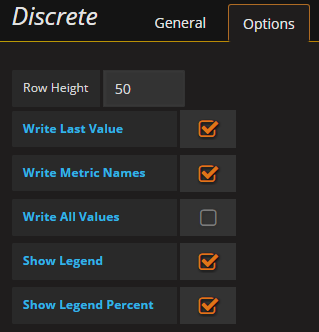
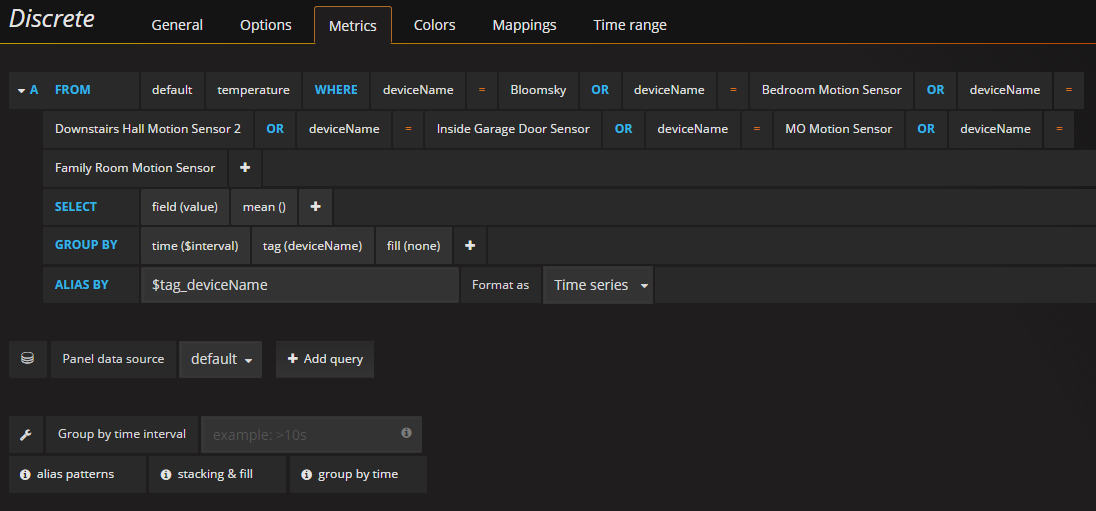
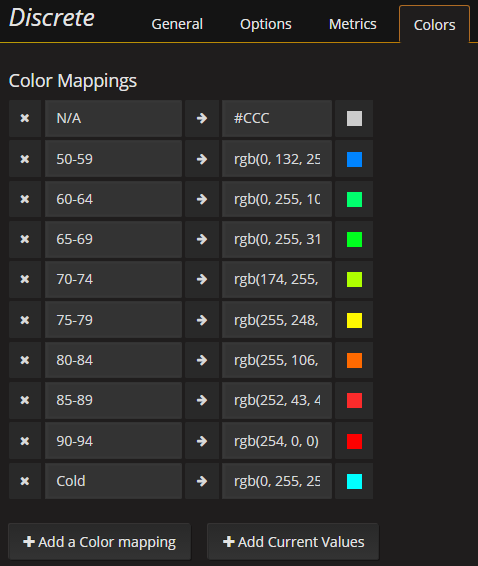
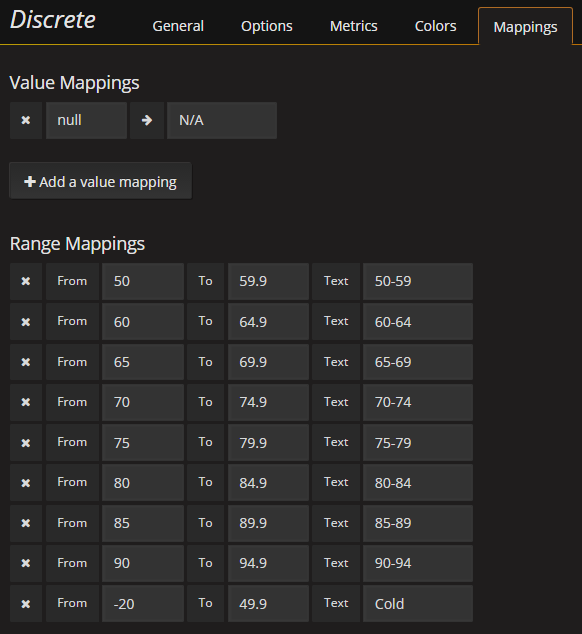
I just discovered that Grafana has a new Discrete panel type plug-in, which can be used to display measurements with non-numeric values, in particular binary and string values! This is perfect for displaying attributes such as presence, motion, smoke, switch, water, thermostat modes etc. ![]()
Some examples:
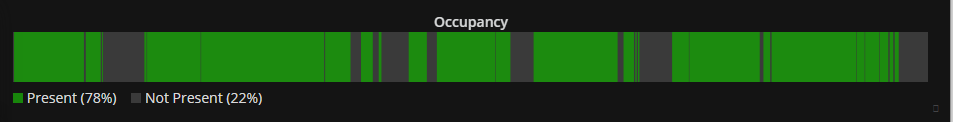
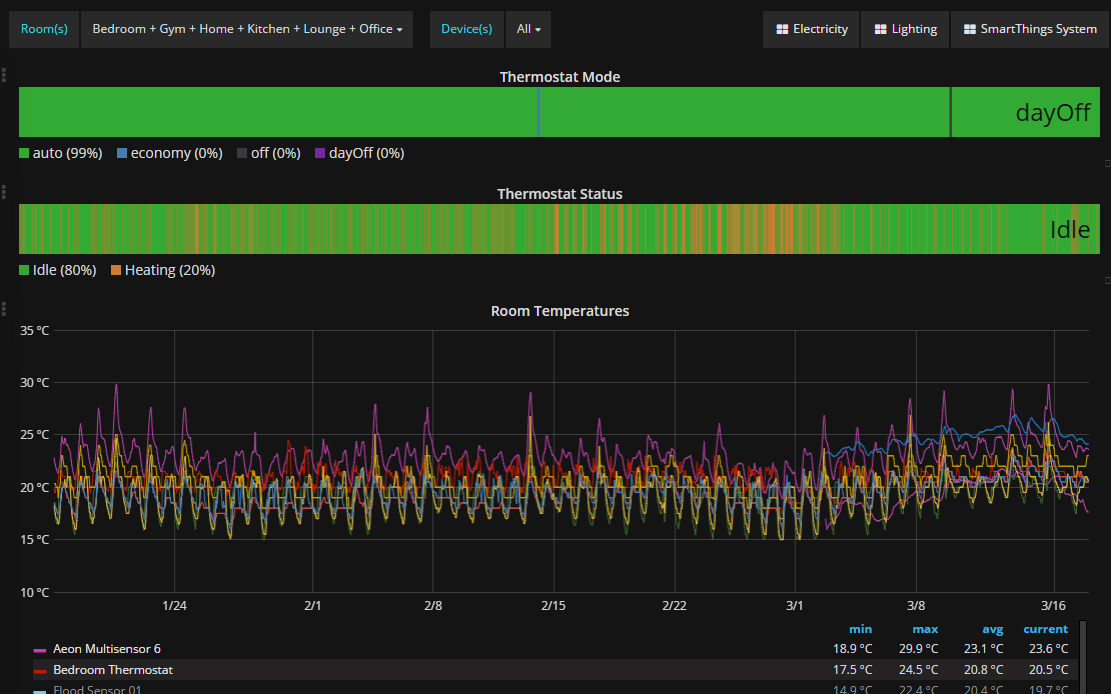
Now we can finally re-create some of the chart types that, up to now, I’d only seen in Initial State. ![]()
5 Likes
Very nice, can you please share how you did that?
Follow the instructions here to install the Discrete Panel. Then add it to a dashboard and have a play!
2 Likes

okay, keeping this thread going… I’m currently graphing light levels using the “level” table in influx.
Works fine, but in the example of a phillips hue bulb: If the switch is in “off” state, it still reports the last known “level”.
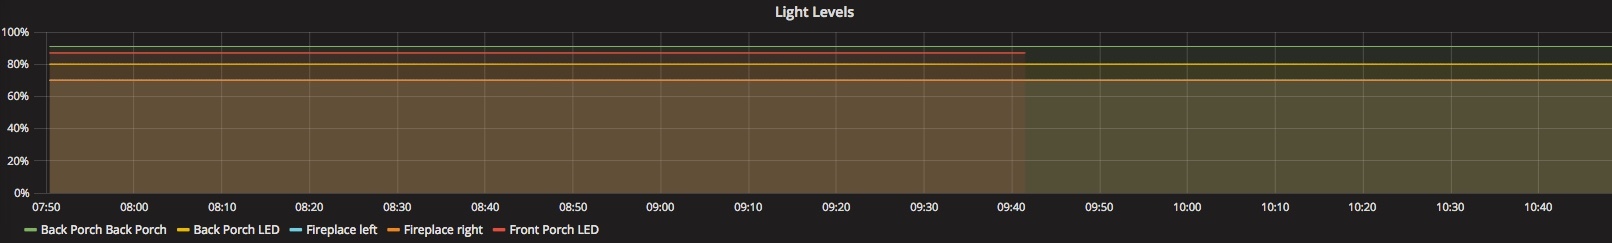
Example where “Fireplace left/right” are actually turned off but still reporting a level in influx:
So on my graph, I’d like the light level to report as 0 if the light (switch) is actually off. So maybe combine a query between two tables for the graph? Maybe I’m overthinking this…
In the following pic, all the switches are actually turned off…
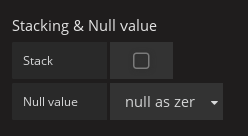
You might need to tweak the settings in Edit → Display and set Stacking & Null value to null as zero. If that doesn’t work, try just null.
Appreciate the suggestion, but that doesn’t work. I think it’s a little more complicated than that.
Let’s focus on the “switchLevel” that is being reported to influxdb. In the code, I believe it’s covered in the catch-all:
    // Catch any other event with a string value that hasn't been handled:
else if (evt.value ==~ /.*[^0-9\.,-].*/) { // match if any characters are not digits, period, comma, or hyphen.
    log.warn "${app.label}: handleEvent(): Found a string value that's not explicitly handled: Device Name: ${deviceName}, Event Name: ${evt.name}, Value: ${evt.value}"
    value = '"' + value + '"'
    data += ",unit=${unit} value=${value}"
}
But what’s happening, if I use “Fireplace left/right” for example, here’s whats reported when “on”:
> select time,deviceName,unit,value from level order by desc limit 10
name: level
time deviceName unit value
1490709606129901194 Fireplace left null 70
1490709606078920907 Fireplace right null 70
The above query was run after turning off those two lights, and forcing the smartapp to send an update to the influxdb. I verified this by running the smartapp manually before and after turning on/off those lights (and checked influxdb timestamps). So the value is still returning 70, which is the level it "last"was (but now it’s turned off).
Also, I’d like to see “unit” report as “level”, so maybe I’d need to add a custom handleEvent(evt) for switchLevel so it doesn’t get caught in the “catch-all” handleEvent()?
I tried messing around with doing just that, but I’m so new to groovy coding, I couldn’t figure it out.
It’s likely the device handler for your hue bulb is reporting a non-zero level value even when the light is off.
Tbh, there is nothing inherently wrong with this as the behaviour of the level attribute in this situation is not explicitly defined by the ‘Switch Level’ capability definition and is open to interpretation. I.e. I have seen some DTHs with the Switch Level capability report the last active level, while others will always report zero when the switch is off.
Either way, you should be looking to change the code in the device handler you are using, so that it behaves as you want it to.
Again, it is up to device handlers to report the correct unit for all attributes. As per the code you quoted, the InfluxDB Logger is passing through whatever unit is defined by the device handler. So the best way to fix this is to edit the DTH code for your hue bulbs to raise level events with a suitable unit.
Note, level is normally represented as a percentage, but there could be DTHs out there that report level using different units. E.g. a device that reports units correctly:
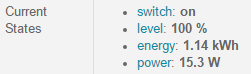
If you really don’t want to edit the DTH, then you could fix the units issue with an extra clause in handleEvent(evt) along the lines of:
else if ('level' == evt.name) { // level: set unit to '%' if not defined.
    unit = unit ?: '%'
    data += ",unit=${unit} value=${value}"
}
Excellent information, appreciate you taking the time to explain it.
Indeed, the DTH is reporting the level as a non-zero number even when the “switch” status is off.
This is right out of the API under “my devices”:
switch: off
level: 70
hue: 14
saturation: 28
color: #FFDF9A
colorTemperature: 3333
So, to expand on your (‘level’ == evt.name), can I add another field to dump in that influx table?
I’d like to have the value of “unit” as the percentage integer, and have a column “status” = on/off based on what “switch” is reporting. If I had both those, I could construct the select statement in grafana to report level where switch=on. (?)
disclaimer: I’m not much of a coder, more of a shell-scripting guy as I’m a unix admin… Be easy on me 
Hmm, that would get rather messy as each event is raised for one attribute only, so you would have to lookup the device and get the current value of switch whenever you were processing a level event, and vice versa when processing a switch event.
Personally, I would be much more inclined to fix the device handler to work the way you want it.
FYI, I would also overlay several measurements in Grafana on the same graph anyway. E.g. here’s what my charts looked like when I was using a DTH that reported the last active level:
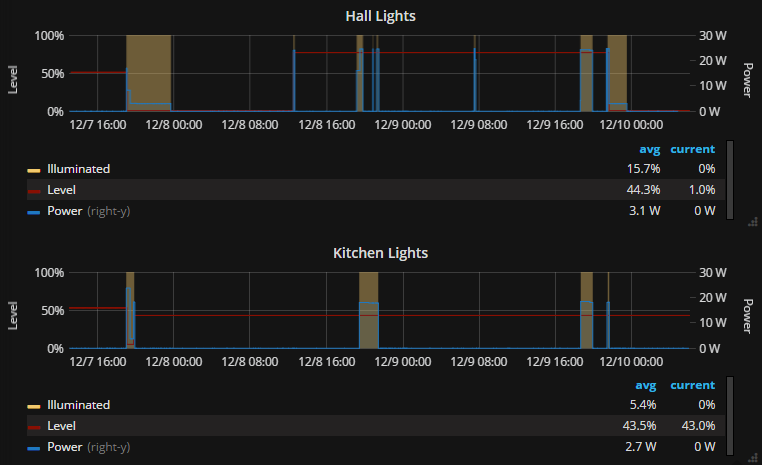
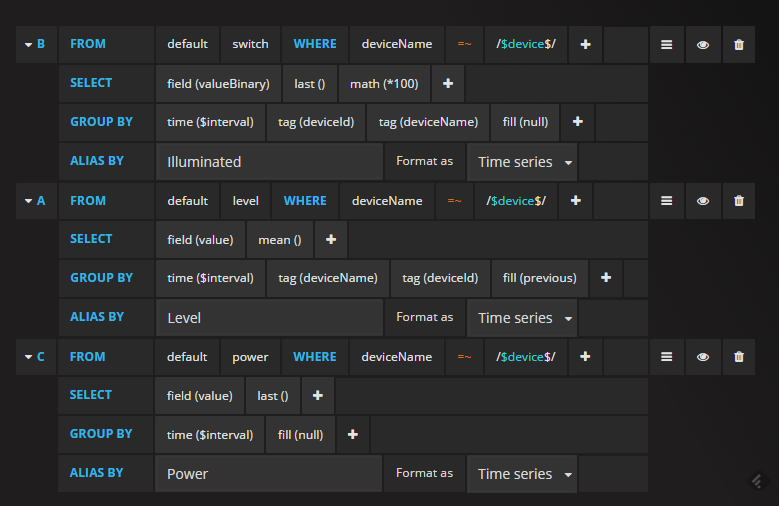
Then it’s pretty easy to see when the light is on or off anyway. And you could probably play with the Z-Index of the series to get Illuminated to hide the Level series when it’s off.
2 Likes
More good info, thanks!
I think I need to change the device handler I’m using for the hue bulbs.
Currently using whatever is the stock one that connects with smartthings. I know I’ve seen quite a few custom ones here on the forums.
I recently completed this setup and the visualizations are pretty cool. I can see how the temperature inside the house swings with the temperature outside and how long it takes the HVAC system to heat to the set point. The Discrete graphing plugin shows occupancy and switch positions nicely as well.
I initially did the setup on Docker for Windows on a machine inside my LAN. The Docker learning curve is a little steep and things don’t work especially great when it comes to mounting local drives from containers. Once I figured all that out things worked smoothly and I was getting great looking graphs from Grafana. Then I decided to move the setup to my Ubuntu 16.04 VPS.
The packages in Ubuntu’s repositories are quite old versions so the backups I made from my local server wouldn’t work. I eventually installed the packages from InfluxDB and Grafana’s websites and passed that hurdle.
Next I discovered that the data logging smart app wasn’t actually sending data to the server. The logging had the usual debug messages for postToInfluxDB() and no error messages but no data was being received by the server. I don’t know if hubAction is strictly limited to LAN hosts on purpose but I found the commented section of code in postToInfluxDB() for WAN hosts. I commented out the hubAction section and uncommented the httpPost section and then data began arriving at the server. I did have to change if (response.status != 999 ) to if (response.status != 204 ) or it would throw an exception for empty response data, a successful write of data to InfluxDB returns a 204 Empty Content code with no response data.
1 Like
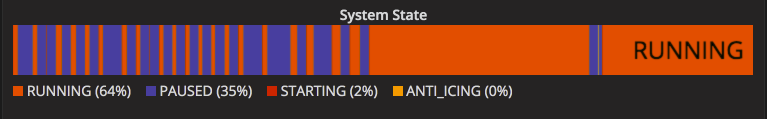
Do you know of a good way to use grafana to show the number of transitions in this binary graph? I played around with “single stat” just a bit but not understanding that yet. It might be nice to also graph other interesting data like average time between binary transitions.
This is a very good question. I tend to use the Discrete Panel type for binary values now and have submitted an enhancement request to be able to display the number of transitions. This type of panel is already able to display the percentage of time covered for each discrete value, so hopefully it’s easy for the developer to add a count of transitions.
Also, for numerical binary values you can use the dervitave function to display the counts. E.g.:
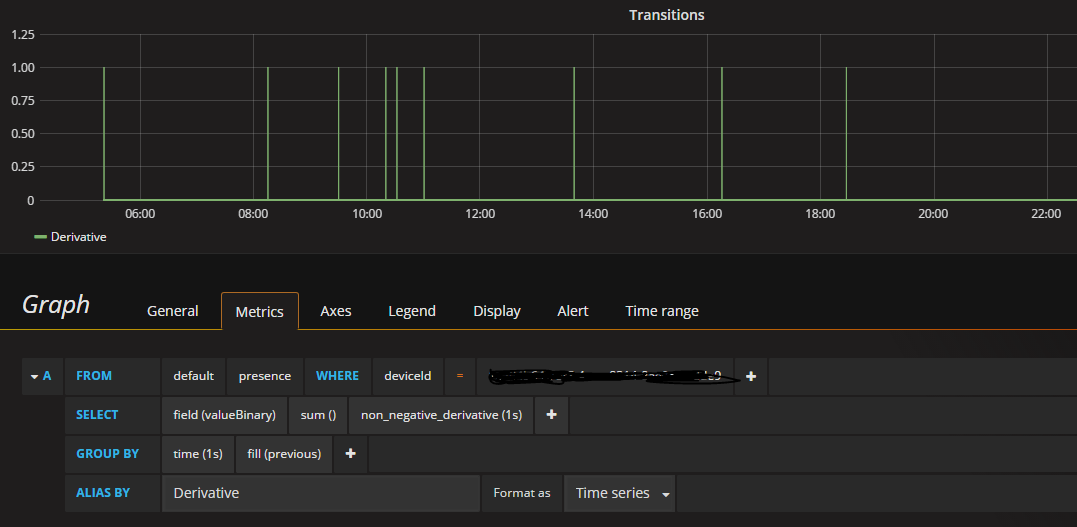
I haven’t worked out how to display this in a histogram though.
1 Like
Thank you so, so much for the InfluxDB smart app. It makes so much possible.
I got rid of the dropouts by setting “Polling” to 0. I don’t think polling is necessary. If a sensor changes, it will send the new value. If the temperature stays the same for 3 hours, we can know that is is still at the same value from 3 hours ago.
I have a lot of sensors and switches, and i’m guessing the polling took too long.
I find the polling setting in the SmartThings app on my iPhone, Smartapps, Influxdb, Polling.
One other thought - i renamed anything that had an apostrophe, like someone said in this thread.