Hi All,
Just wondering if anyone had a go at downloading electricity usage information from their Power Utility company, presuming you have a smart meter and your provider gives you access to said data in some way. I am already graphing temperatures and other things around the house, so graphing the power would be useful.
I’m a customer with NVEnergy and they provide this nifty website where you can see your electricity usage for your entire house down into 15 min intervals:
NVE offers a way to manually download your data, which involves ordering the data, waiting, receiving an email with a download link and finally downloading a csv or something, i.e. practically useless from an automation perspective.
NVE aren’t much help as they do not offer any API or SDK to pull data down, so I figure the java scripts they are using to render the graph with, should be fair game. Yet before I start poking around, I just wanted to give a shout out to the ST community to see if anyone else has/is working on something similar?
Btw: I noticed this Ruby project on github, yet I’m not sure that’s what the doctor ordered as it seems to be bill download. I want the raw data which the graphs are being drawn uppon, not the PDF files
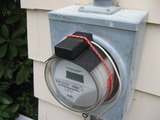
Another approach I’ve been considering is sticking a passive IR detector on top of the meter to count kWh blips from the meter using an Arduino/Raspberry (See this video. Note: You don’t need IR goggles to see the blips, a regular smartphone camera can see in infrared)
Either way, if anyone have any experiences in this area I’m all ears, as I hate to re-invent the wheel as much as the next guy
Quite a few people have done something like this. The options you have will depend in part on your utility company.
See the data logging faq for information on the various methods available: ( The topic title is a clickable link)
In addition, some utility companies that offer smart meters will allow you to attach the “Rainforest Eagle” reporting device to their Zigbee network and then you can get information from it. See the following for a discussion of how it works:
15 minute intervals is pretty good. If I could have scraped that from javascript then I would have preferred it, no new equipment to install.
I suspect most of the user collecting power data here, installed physical power sensors in the distribution panel, using something like Aeon Home Energy Meter(HEM) v1(amps only, on battery) or v2(plug-in) .
pink solid is the house power usage - graphed by Grovestreams:
Hi Eric, JD thanks for the suggestions. As of now I’m pretty familiar with the graphing options. I started originally with a GoogleSheets to monitor temperatures, which I’ve integrated into my ActionTiles:
However it’s more getting the data from NVE which is my focus. If that turns out to be a no-go then it’s either the Rainforest Eagle which JD suggested, or perhaps the TED device (works in a similar fashion with inductive clamps on the main wires in the circuit breaker panel).
If these should be too difficult to integrate, my fallback plan is to make a smart device out of this project monitoring the led blips the meter hopefully gives off (haven’t checked mine yet)
Anyway, as much fun as it is to build custom devices, I’m still somewhat peeved by the fact that the usage data is available via the provider’s website, but not in any automation-friendly manner. Hoping at some point to join forces with someone a bit more coding savvy, experienced in pulling data out of websites.
Hi guys… I found this old thread. I too am a NV Energy customer. Just wondering what you ended up doing? I would love to be able go get that data into Home Assistant or Smartthings.