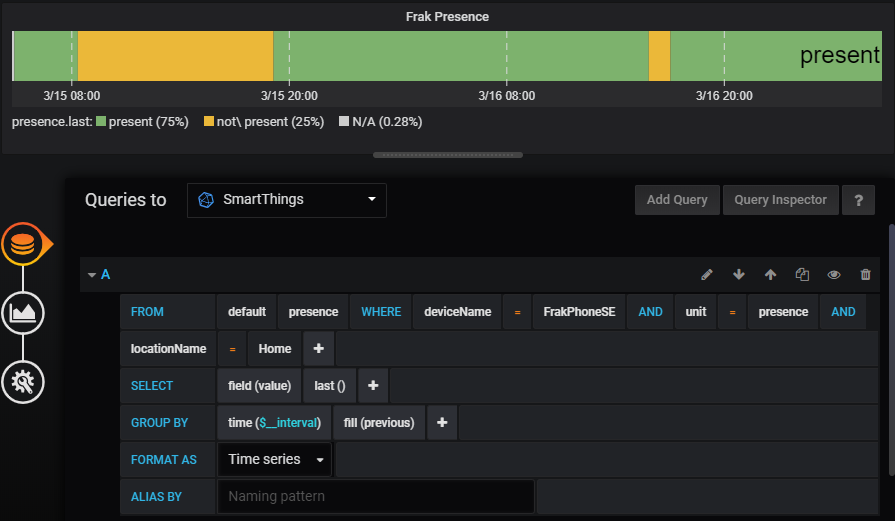
Use the Discrete plug in and map the values from the query to different colors. The query will return things like ‘on’ and ‘off’ or maybe a list of things. I visualize the HVAC state of heating, idle, cooling, fan only using this technique as well as simple light on or off.
Thank you @Stephen_Johnson . I installed the Discrete plugin and selected it in the new panel. I’m struggling to craft the right Query. Can you please post what your Query looks like?
I tried this but nothing showed up:

UPDATE
I figured it out (finally). I had to fiddle with the Query string some more.
I had to do something like this:
@Rawle_Gibson Did you ever figure out the localhost hub action is not allowed error?
Hi Guys,
Is there a simply way to get a table in Grafana as follows across all rooms / devices?
Time, Room Name, Device Type, Device Name …
The measurements output to InfluxDB currently are across device-specific items such as power, battery, contact, temperature therefore devices with battery will output to battery measurement but devices without battery wont - There doesn’t seem to be a single measurement called say “devices” which lists all devices, their type, room and the last time they polled etc?
Thanks!
Can anyone help me with a basic influx query?
> SELECT * FROM "contact" WHERE ("deviceName" = 'Upstairs Balcony Door')
name: contact
tags: value=
time                           deviceId   deviceName            groupId   groupName hubId   hubName         locationId    locationName   unit    value  valueBinary
----                           --------   ----------            -------   --------- -----   -------         ----------    ------------   ----    -----  -----------
2019-08-18T18:20:46.306634978Z XXX        Upstairs Balcony Door YYY       Unknown   XYXYXYX SmartThings Hub WWWWWW        Location1      contact closed 1
2019-08-18T18:30:58.424751053Z XXX        Upstairs Balcony Door YYY       Unknown   XYXYXYX SmartThings Hub WWWWWW        Location1      contact closed 1
2019-08-18T18:40:43.139929191Z XXX        Upstairs Balcony Door YYY       Unknown   XYXYXYX SmartThings Hub WWWWWW        Location1      contact closed 1
I see dozens of ‘closed’ lines, then dozens of ‘open’ lines, then dozens of ‘closed’ lines…
How can I change the query to only show the first row each time the contact status changes?
Looks like the InfluxDB Logging SmartApp has the option enabled to send data to InfluxDB, even if the value has not changed. The timing appears to be every 10 minutes. You might be able to disable this feature in the InfluxDB SmartApp to prevent the duplicate records. I am not sure how you would modify the InfluxDB query to not return these duplicate records. You might want to try posting this question on the InfluxDB Forums if you don’t get a result here.
Are you wanting a single row showing the ‘last’ time the value changed?
Influx has some ways to get the first or last row in a time frame but it depends on what you’re trying to do. One way would be to query for each value, order them, then include a ‘limit 1’ on the query. Or you can use the ‘last’, or ‘first’, aggregators.
I would need to get back to my computer to figure out the exact syntax but it will be something like:
“SELECT LAST(field_name), * from test_result GROUP BY *”
Or
“SELECT * FROM GROUP BY * ORDER BY DESC LIMIT 1”
Are you wanting a single row showing the ‘last’ time the value changed?
No - I’m wanting to show only changes, eliminating “duplicates”
I am tryng to install this. Unfortunately when I install influxdb on my PI3 , it uses 100% cpu and does not start fully.
Is there a known workaround for this ?
also, is it possible to use mysql instead of influx ?
Check which metrics influx is collecting on the PI itself. It “should” run.
I didn’T understand what you mean.
influxd is running but not starting. It uses 100% cpu.
A lot of things could be causing the slowdown. Are you using the PI 3b or PI 3b+ ? What else is running on the device? With regards to influx, it has some self monitoring in the configs for reporting its own cpu/temp/speed/etc are those configured. What is the speed and size of the SD card.
Maybe you can post a photo of the screen after running the htop command.
well, I have Asterisk (voip server) running on PI3
But it is normally using 1-2% cpu.
High cpu occurs as soon as I run influxdb
I saw the self monitoring adjustment and actually did it.
it didn’t solve my issue.
Then I removed influxdb and reinstalled. Now the /etc/influxdb/influxdb.conf file is not there.
No matter what I do (I removed and installed several times) I can’t get the config file.
anyway ,I gave up and installed on Windows server (both grafana and influxdb) now.
On windows server:
Grafana works, influxdb works., I created the DB and added it to Grafana as a datasource.
I counfigured the smart app to send all events from all devices.
But then I don’t know how to add graph from the datasource.
is there any guide for that ?
I’ve done it for temperature.
But it just puts points on the graph for all readings from all temperature sensors.
How can I draw lines for each temp. sensor ?
In the visualization section of the panel there are settings for the graph to draw bars, points, or lines. Just turn on the type you want to see. Lines in this case obviously.
This assumes your query is set up right. To get the data by device you want to choose the deviceName field as the metric.
thanks.
I select “lines” but it puts points for every reading of temperature.
it draws lines when I select (null value connected)
but I could not find how to select deviceName as metric .
how do you select a metric in influxDB datasource ?
Until yesterday I was only using mysql datasource on Grafana and there I can select metric.
On influxDB , I couldnt find it…
also, how can I disable visualization of alerts on the graph ?
I don’T see the “metrics” tab when I create a panel with influxdb as datasource.
why ?
Also, how can I remove some wildcard pattern from metric names ?
for example, in the following graph , I want to remove “temperature.mean” from the legends.
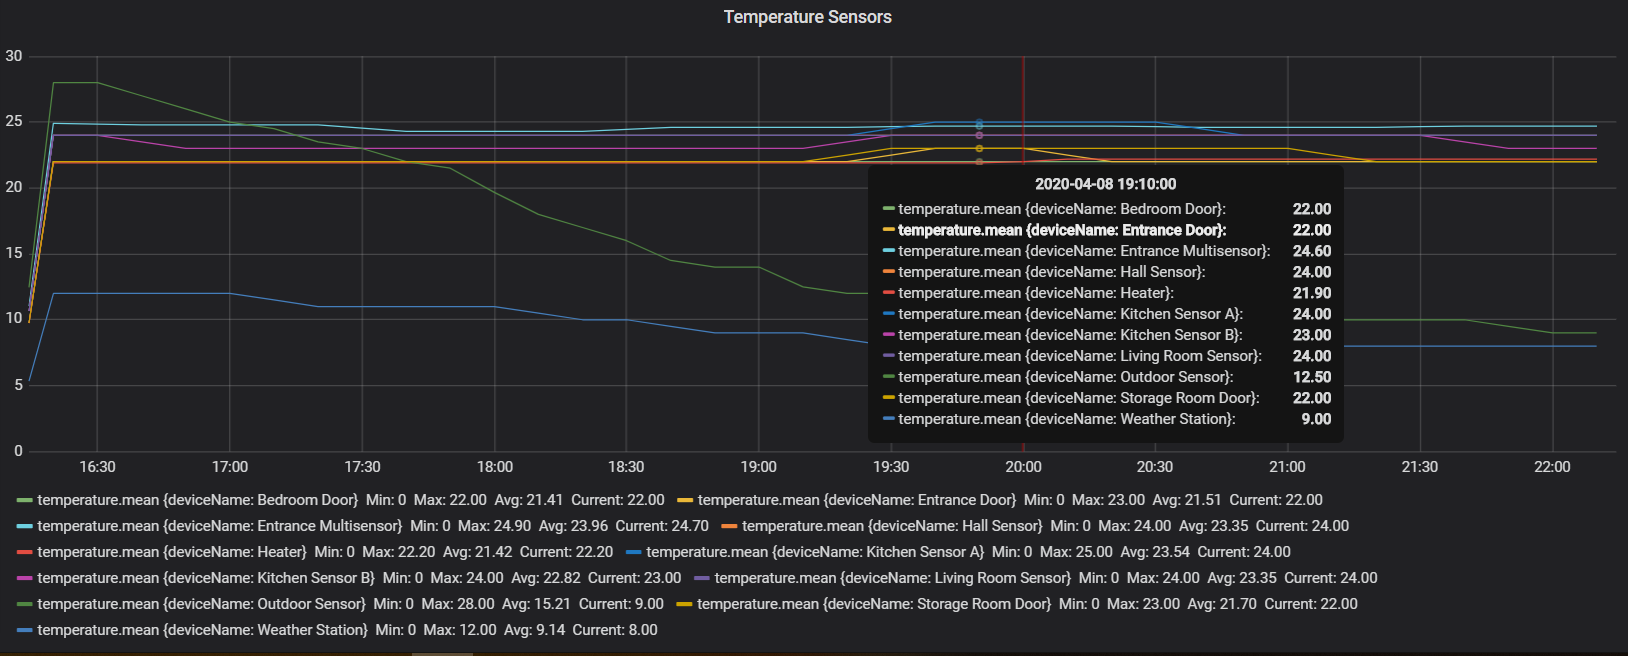
You’re right, I was looking at a panel using mysql but the influxdb query builder does look different.
It looks like you have the graph pretty much like you’re after. To get the names right you can put $tag_deviceName in the ‘alias by’ section of the query.
thank you.
is there anything to do to make the cells below smaller ?
There are more sensors but they don’T fit the page width because of those large cells.

Thank you @zcapr17 for your smartapp and guides.
Got this setup and working for the most part. Has anyone noticed any significant delays in Grafana output compared to the events on SmartThings itself? This is particularly noticeable for binary switches, rather than energy or temperature graphs.
Sometimes a switch state change (like turning off a smartplug or unlocking door) will show in a few seconds in Grafana, and sometimes take 5-10 minutes. In Grafana I’m using Polystat Panel and monitoring a binary value for a given switch and monitoring last value only. So removed mean/average/etc to speed up graphing. The influxdb-logger app shows state changes immediately in IDE live logging. So its aware of these changes in near real time to pass to InfluxDB itself. But having difficulty working out where delays can be from there onwards.
Can it be with Influxdb-logger sending the data and it registering on InfluxDB. Like a fundamental lack of CPU resource on the SmartThings Smart Hub? (in my case a V2 Smart Hub) However, as I’m seeing the events appear on the web via IDE immediately, my guess is this isnt a problem.
Or is it more likely to be my InfluxDB database itself? Im a complete novice when it comes to InfluxDB. I do believe my setup has adequate computer resource. It’s running in a Docker container with plenty of RAM, SSD and CPU available, as is my Grafana. The database is at default values and nothing added outside of the guides. But as for whats going on inside it, I’m a bit out of my depth.
If no one else is experiencing these delays, then it must be my setup and I’ll try again. Possibly on a new computer with direct install rather than containers.
Attached my Grafana screen so far for reference. Forgive the ugliness, it’s just proof of concept at the moment before I try make it pretty. The delays to appear show in both the On/Off switches and the energy graphing. So I don’t believe the problem is with a single graphing setup
Thanks in advance for any insights.
