You seriously can’t beat this setup for ability to view specific timeframes, easily change what exactly you see, and not have the absurd slowdowns Google Sheets has when you have a half million entries on a single Sheet.
Hi all,
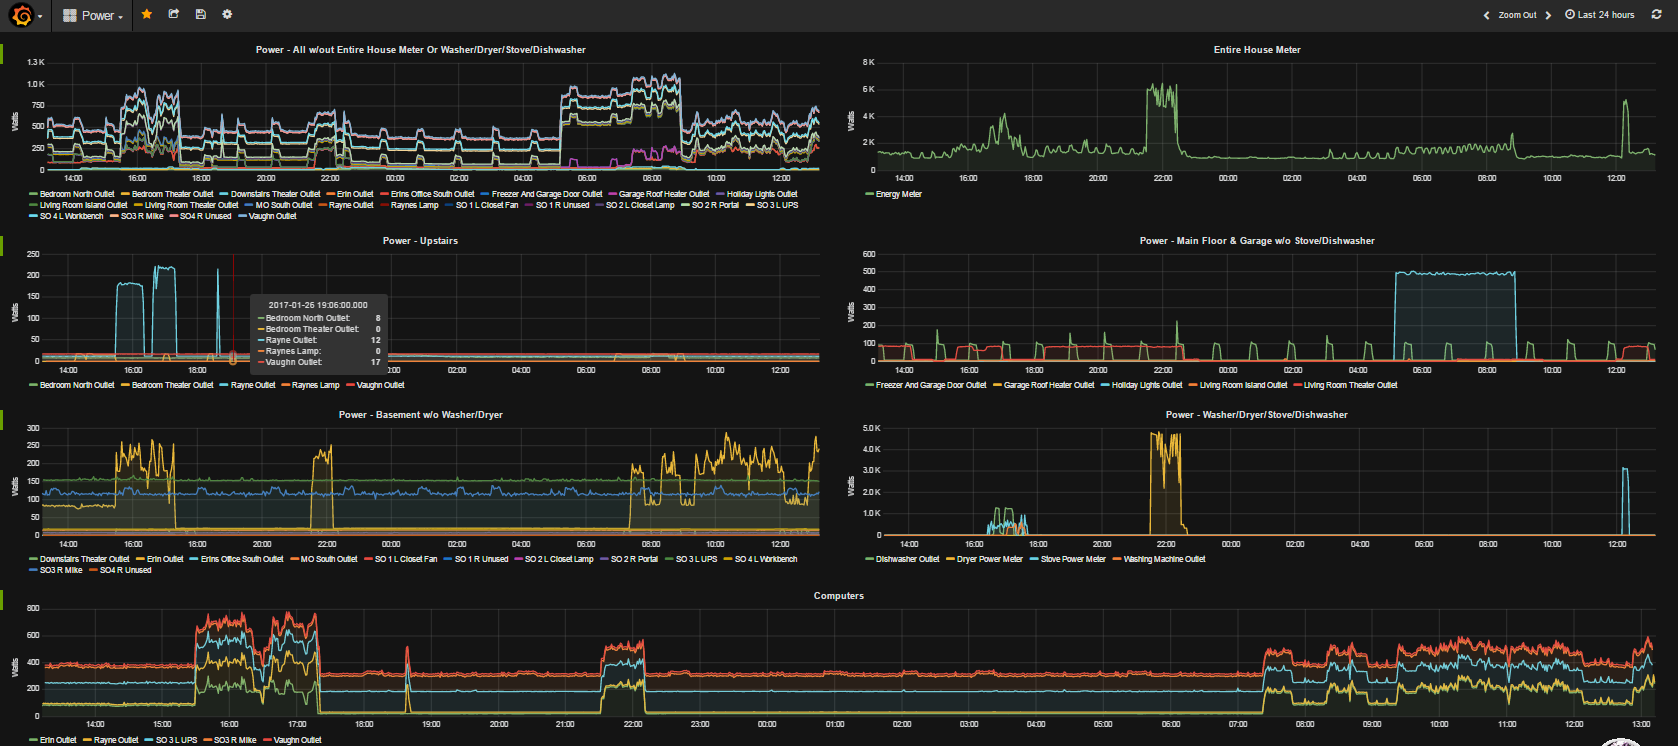
Here’s a write-up of how I’m using InfluxDB and Grafana to visualise SmartThings device states in charts and dashboards.
The solution uses a custom SmartApp I’ve written to send data from SmartThings to InfluxDB. Crucially it supports the database server being on the same private LAN as the SmartThings hub, so there’s no need to make your database server accessible from the internet.
I’m quite pleased with it so far. In conjunction with my Evohome (Connect) SmartApp I’m getting some great graphs of my home heating behaviour and energy usage.
Here’s an example of a temperature chart:
[image]
Here’s an Evohome Heating Zone chart with some overlays:
[image]
I aim to post another article covering some of the more-advanced Grafana features like templating and annotations in th…
3 Likes