but I am getting this error: monitor_1 | 2023/01/19 17:37:50 ERROR: could not convert to number there is no value map for metric 'thermostatOperatingState' and value 'heating', can't convert
What am I doing wrong in my configuration file that is preventing this from converting. The switch value appears to work
One question: I’m trying to replace influxdb-logger smart app which I’ve been using for years. As a result the entries in my influxdb are saved with ‘deviceName’ being the device, i.e. deviceName=‘Living Room Sensor’
Running smartthings-influx it correctly grabs that sensor and saves it to the influx database, but with the entry being ‘device’ instead of ‘deviceName’.
I’d like to continue the existing data in my database, would it be possible to specify in smartthings-influx whether to use ‘device’ or ‘deviceName’? Or is there a simple way to modify all my existing data entries from deviceName to device?
Per this post it might not be possible to rename the field directly but write it back to a new measurement. I am going to test it out today with my legacy Smarthings data (from the smartapp)
Thank you @eargollo. I have been using the binary to update my legacy data but I’ve realized that your program skips repeating values. This is causing some unintended results in my aggregation charts. Is there a way (argument or config file variable) that I could use to instruct it NOT to skip repeating results?
Forgive me for being stupid; but could someone point out which version of smartthings-influx to download for raspbian buster please? In fact precise instructions as to how and where to install and run it would be great if you take pity on me.
I have grafana and the InfluxDB Logger SmartApp all set up by following codersaur’s previous instructions, but now there is obviously no data and charting as the SmartApp no longer works.
If I download the binary for Linux to /home/pi/, do I need to do anything to run it? Like start a service? I see mention of ./smartthings-influx monitor.
I know I need to create a .smartthings-influx.yaml file.
Couple of options, assuming you have access to the console on the pi, you can manually run it with the command mentioned ./smartthings-influx monitor
It will use the local .smartthings-influx.yaml and start collecting and adding data to the influxdb. The schema is different from that of the older influxdb logger so you may have to recreate any visuals on the new data.
As for running it as a service, you will have to look up how to run a bash script when booting in. Unfortunately my knowledge of the Rasberry Pi system is a little rusty, but this is what I found on the internet - Run script on startup | The Raspberry Pi Guide
I managed to tweak some code on the monitor.go file to push time.now as the device time rather than what was returned from SmartThings. this has solved some of my earlier issues where battery and temperature readings were returned once in a week. This was my first time at Go so if you see any obvious issues, please let me now.
for i, dev := range devices.Items {
            now := time.Now()
			log.Printf("%d: Monitoring '%s' from device '%s' (%s)- my time (%s)", i, dev.Capability.Id, dev.Device.Label, dev.Device.DeviceId, now)

			// Get measurement
			status, err := dev.Status()
			if err != nil {
				log.Printf("ERROR: could not get metric status: %v", err)
				continue
			}

			for key, val := range status {
				if val.Value == nil {
					log.Printf("WARNING: Got nil metric value: %v", err)
					continue
				}

				// Get converted value
				convValue, err := val.FloatValue(key)
				if err != nil {
					log.Printf("ERROR: could not convert to number %v", err)
					continue
				}

				log.Printf("Key is %s value %v number value %f", key, val, convValue)

				//if lastUpdate[dev.Device.DeviceId] == val.Timestamp {
					//log.Printf("No changes since last query. lets see.")
					//continue
				//}

				// Create point
				point, err := client.NewPoint(
					key,
					map[string]string{
						"device":     dev.Device.Label,
						"component":  dev.Component.Id,
						"capability": dev.Capability.Id,
						"unit":       val.Unit,
					},
					map[string]interface{}{
						"value": convValue,
					},
					now,
				)
				if err != nil {
					log.Printf("could not create point: %v", err)
					time.Sleep(time.Duration(mon.interval) * time.Second)
					continue
				}

				bp.AddPoint(point)
				newLastUpdate[dev.Device.DeviceId] = now

			}
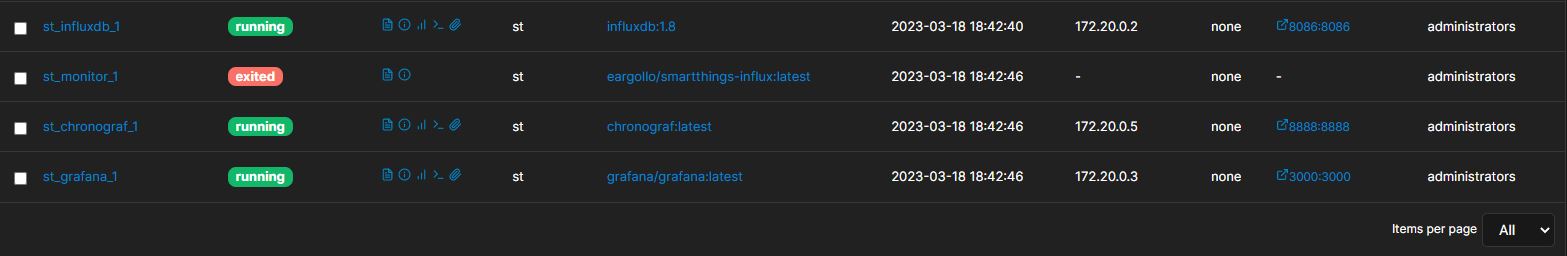
I have a problem after i execute a docker compose up command, the influxdb, grafana and chronograf are running well but the st_monitor_1 stop running after a few seconds. The following message are showed when i check the log:
“Using config file: /.smartthings-influx.yaml
2023/03/18 21:42:55 Error: Unsupported protocol scheme: , your address must start with http:// or https://”
The problem is that in this file is seams its everythings well, i already configured the same influxurl variable on docker compose to check if this was the problem but the process still stop after some seconds. The config file is showed below,
I just got a Raspberry Pi and want to start logging information from my SmartThings sensors. It looks like most of the previous solutions went kaput with the move from Groovy to Lua/Edge. In fact, this is pretty much the only project I can find. I notice that the documentation on GitHub states that this project does not yet support InfluxDB 2.x. I’m curious about the path/timeline to supporting to most recent versions of InfluxDB. Is there a major hurdle to supporting InfluxDB 2.x, or just that the developer hasn’t had the time to update code yet (which is completely understandable, considering that the solution is a “goodness of the author’s heart” project that isn’t making anybody any money)?
I work in information security so the idea of using older, unsupported software that is unlikely to be patched by the vendor makes me uncomfortable. Also, keeping the software current on my Pi will be much easier if I can just tell it to update all software. So I’d really prefer to wait until InfluxDB 2.x is supported if at all possible.
Are there any plans to update this project to support the latest versions of InfluxDB?