interesting, no change. Closed active browser window, re-logged in, same problem, full page refresh, same problem from Chrome.
Opened Firefox (was not running, and had not been used for this site), same issue.
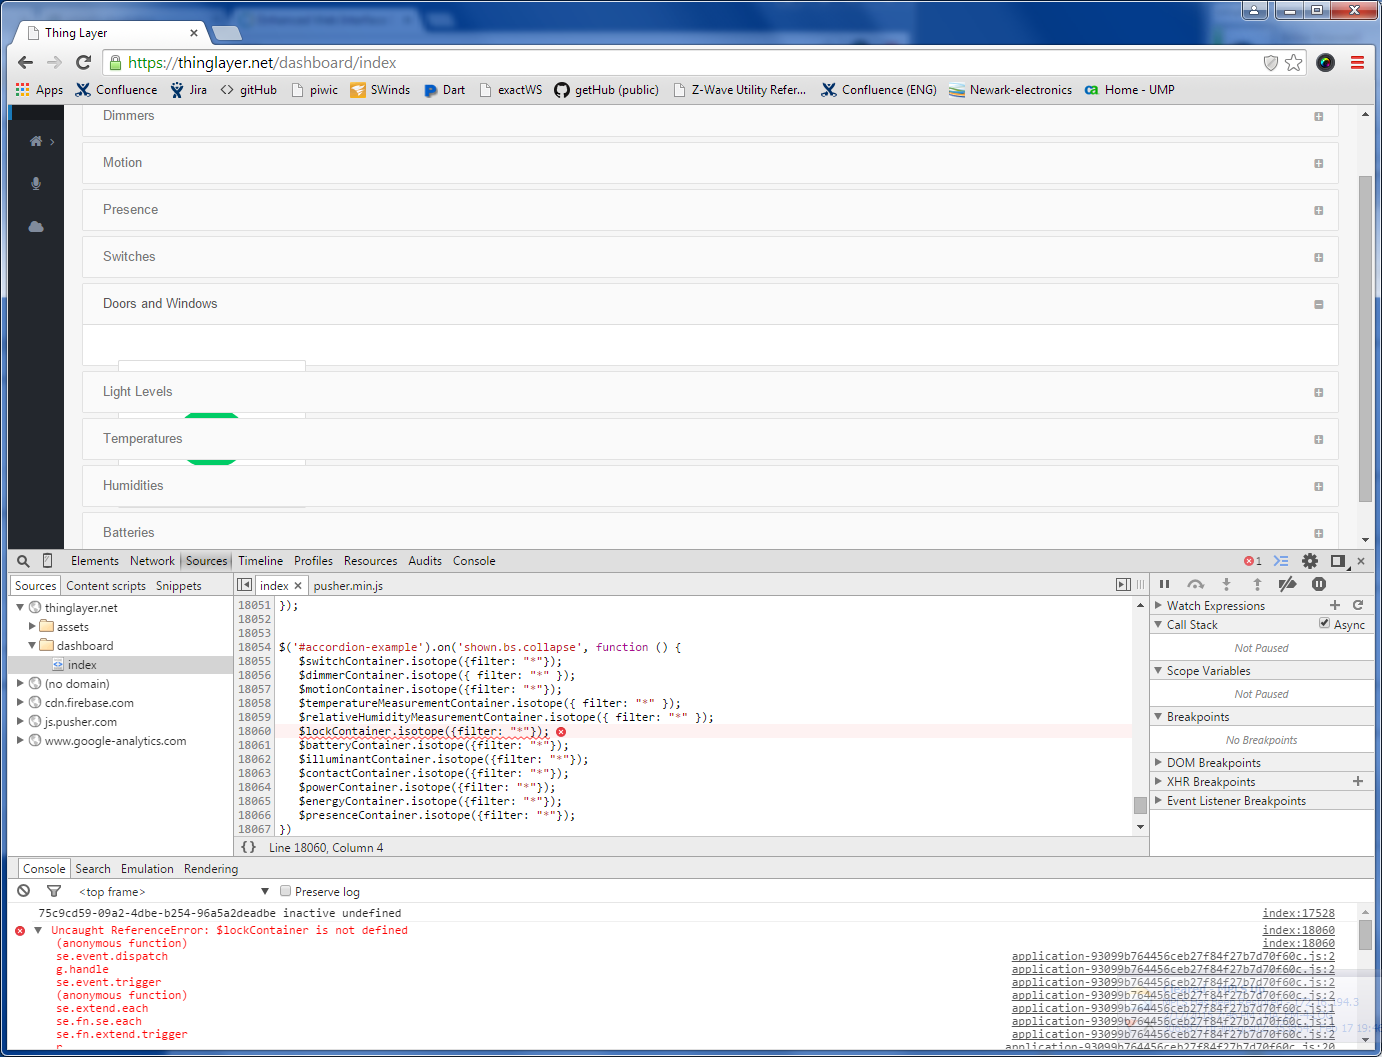
I am getting these in Chromes debug console, and they are generated when this problem happens.
OK. Got it. It’s because you don’t have any locks and it’s breaking there. I need to add a check to the code to prevent it. I never see it because I have at least one of everything. Thanks @Mike_Maxwell
Sorry, spoke too soon. The dashboard works great now but when I click on the energy meter (Or anything else) to see the graphs it crashes with the following error:
  We're sorry, but something went wrong.

If you are the application owner check the logs for more information.
Working like a champ, I have to say I really like this thing.
Not sure how deep you are looking to go with this but one feature I would love to see in the future is graph overlays - See a spike in energy usage and when you hover over it it tells you that the Upstairs Heater kicked on or that the clothes dryer started (Obviously dependent on if that information is available).
@jody.albritton
Couple of thoughts on the charts.
–Currently it appears that the x axis of the charts are plotting the timestamps based on available sample pairs. Changing the x axis to fixed intervals (vs sample intervals) would make the charts easier to read, since not all devices have the same reporting intervals.
–Any chance you can add charts for motion and contact devices?, or in general the remaining devices?
–Multi series charts based on the selected capabilities zone filters?, I’m constantly wanting to know how various capabilities are trending across multiple devices.
I really like what you’ve done so far, I use this dashboard every day.
I am open sourcing the thinglayer platform this week. Hopefully this will open up some development as far as widgets, tiles, and graphs. I have been putting most of my efforts into removing any closed source code from thinglayer and creating documentation.
The current iteration of the graph is the quickest I could get going for a proof of concept. I have many additions to graphing including set intervals (5 min, 1 hour, 1 Day, 1, Month)
I had contact charts in at one point. I was not happy with the way it appeared. This is something I will revisit.