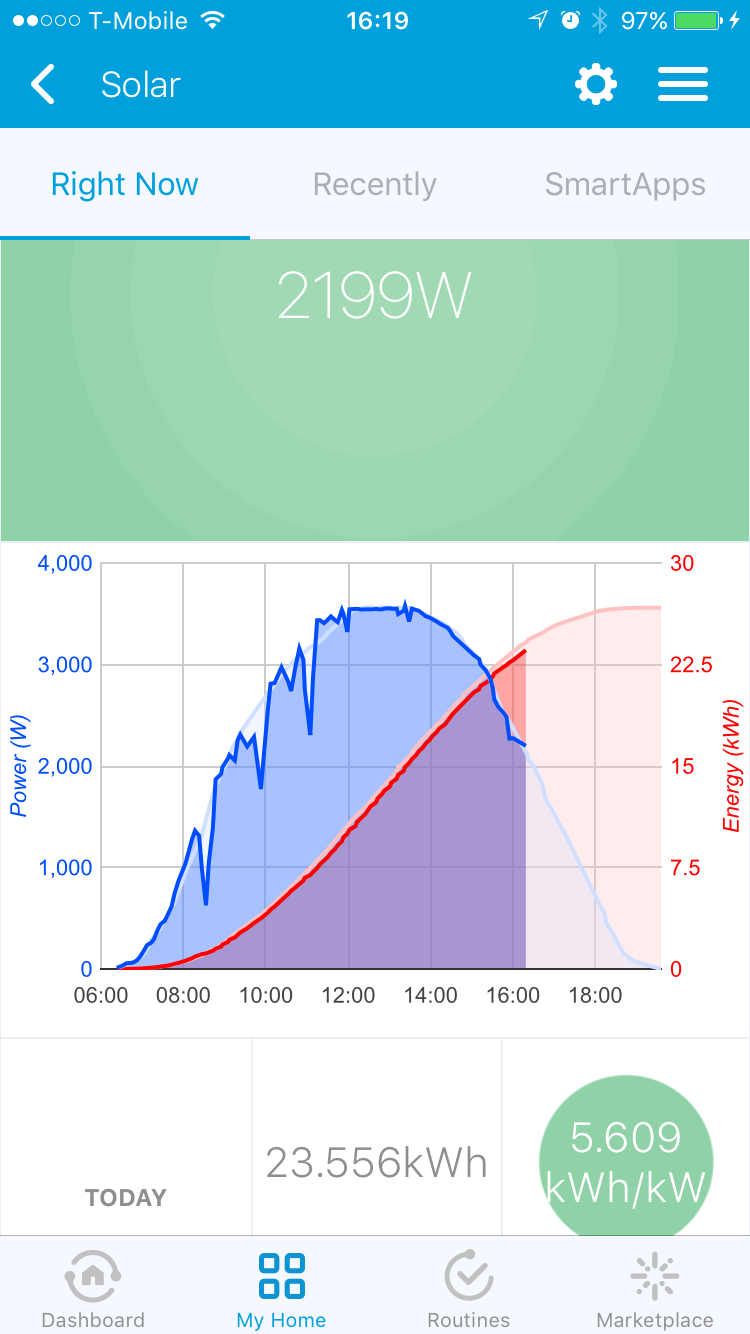
Latest update on Github now displays the power and energy readings for the current and previous day on a graph below the main tile (power in blue, energy in read - previous day in light, current day in solid colors):

(Note: the lack of details on the main tile is due to the current ST application bug which no longer displays the SECONDARY_CONTROL for a multiTile).
Here is what the tile looks like on a  day (at least what we call cloudy around here
  ) - I also updated the visual appearance some more (added vertical axes labels and color codes them to make it clearer which data belongs to which axis) and fixed a stupid bug causing the energy data to show up as a staircase before (
integerValue() for a float value was not the best idea…):